

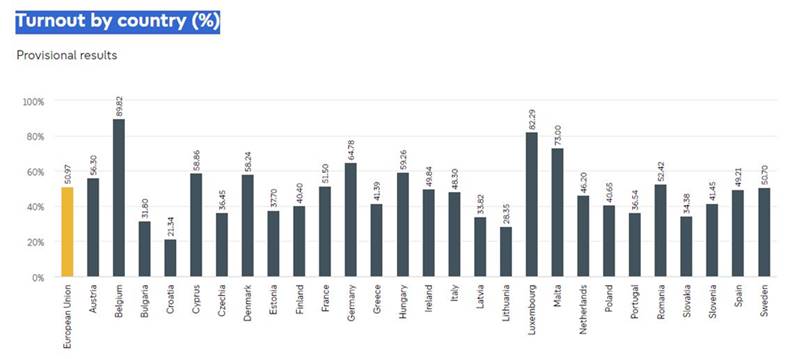
EU Elections 2024: In the 10th European elections held on 6-9 June 2024, EU citizens voted with a 50.8% estimated turnout. The European People’s Party (EPP) gained the most seats with 25.83%, followed by the Group of the Progressive Alliance of Socialists and Democrats in the European Parliament (S&D) with 18.75%. The total seats amounted to 720. Each political group must have at least 23 members elected in seven Member States. The results for each Member State varied between provisional and final, and a constitutive session will determine the official composition of the newly-elected European Parliament.
In European Elections 2024, EU citizens cast their vote in the 10th European elections on 6-9 June 2024
According to Parliament’s rules of procedure, a political group shall consist of at least 23 Members elected in at least seven Member States.
DATE: 11/06/2024
Preliminary figures suggest an estimated turnout across the EU of 50,8%.
EU Election Results 2024: Member State Breakdown and Official Updates
Total Seat: 720
Gainer: EPP – Group of the European People’s Party (Christian Democrats) 186 – 25.83%
| Political groups in the European Parliament | Number of seats | % of seats |
|---|---|---|
| EPP – Group of the European People’s Party (Christian Democrats) | 186 | 25.83% |
| S&D – Group of the Progressive Alliance of Socialists and Democrats in the European Parliament | 135 | 18.75% |
| Renew Europe – Renew Europe Group | 79 | 10.97% |
| ECR – European Conservatives and Reformists Group | 73 | 10.14% |
| ID – Identity and Democracy Group | 58 | 8.06% |
| Greens/EFA – Group of the Greens/European Free Alliance | 53 | 7.36% |
| The Left – The Left group in the European Parliament – GUE/NGL | 36 | 5.00% |
| NI – Non-attached Members | 45 | 6.25% |
| Others – Newly elected Members not allied to any of the political groups set up in the outgoing Parliament | 55 | 7.64% |
According to Parliament’s rules of procedure, a political group shall consist of at least 23 Members elected in at

Available results by Member State
| Country | Type of results | Last update |
|---|---|---|
| Austria | Provisional results | 11/06/2024 – 12:00 |
| Belgium | Final results | 10/06/2024 |
| Bulgaria | Provisional results | 10/06/2024 |
| Croatia | Final results | 10/06/2024 |
| Cyprus | Final results | 10/06/2024 |
| Czechia | Final results | 10/06/2024 |
| Denmark | Provisional results | 10/06/2024 |
| Estonia | Provisional results | 10/06/2024 |
| Finland | Provisional results | 09/06/2024 |
| France | Final results | 10/06/2024 |
| Germany | Final results | 10/06/2024 |
| Greece | Final results | 10/06/2024 |
| Hungary | Provisional results | 10/06/2024 |
| Ireland | Not available | Not available |
| Italy | Provisional results | 10/06/2024 |
| Latvia | Provisional results | 10/06/2024 |
| Lithuania | Final results | 10/06/2024 |
| Luxembourg | Final results | 10/06/2024 |
| Malta | Final results | 10/06/2024 |
| Netherlands | Provisional results | 10/06/2024 |
| Poland | Final results | 10/06/2024 |
| Portugal | Provisional results | 10/06/2024 |
| Romania | Provisional results | 10/06/2024 |
| Slovakia | Final results | 10/06/2024 |
| Slovenia | Provisional results | 10/06/2024 |
| Spain | Provisional results | 09/06/2024 |
| Sweden | Provisional results | 11/06/2024 – 12:00 |
Note:
Type of results:
Estimates: Aggregation established by Verian of available national estimates or polling data resulting from the elections and published in a given Member State after voting has finished, based on well-known and reliable national polling institutes.
Projection: The projection of the European Parliament is an estimate of its composition resulting from the elections, established by Verian as an aggregation of available election results, estimates or polling data published in the Member States after voting has finished. Without prejudice to the composition of the newly elected Parliament, the projection is based on the structure of the outgoing Parliament.
Provisional: Composition of the European Parliament based on available provisional or final national results published after voting has finished in all Member States, based on the structure of the outgoing Parliament.
Provisional results: First results as presented by the Member State’s official election authority on the basis of a percentage of votes counted.
Final results: Results as published by the Member State’s official election authority after all of the votes have been counted.
Official results: Definitive results as proclaimed by the Member State’s official election authority and validated by the national legislative authority.
Constitutive session: Results as officially announced by the newly-elected European Parliament after verification of its Members’ eligibility criteria.
Outgoing Parliament: The European Parliament is configured as in the last parliamentary session of the ongoing legislature.