Civilizational History of North America
Governing the American Government
The $49 Trillion Cost of the DSA Agenda: 2026 CEA Report
Published by the Trump Administration, Government of America
White House Document
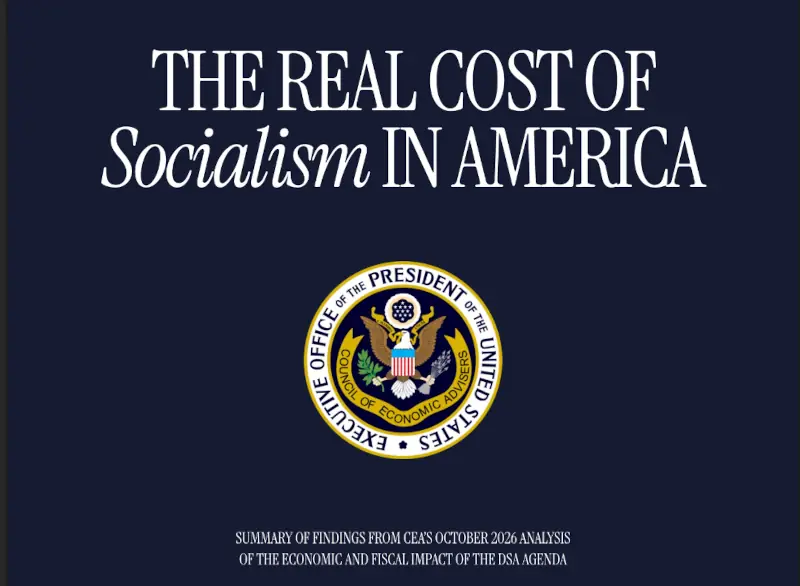
THE REAL COST OF SOCIALISM IN AMERICA
Scoring the Economic and Fiscal Impact of the DSA Agenda
The Council of Economic Advisers (CEA) | October 2026
FOREWORD
Upon taking office, the Trump Administration worked to secure the border, unleash American energy, usher in new investment, make life affordable for working families, and right-size the federal government. These policies have driven a manufacturing boom and made the country more affordable.
The Democratic Socialists of America (DSA) have offered an alternative vision, relying on taking resources from workers and entrepreneurs or taxing the income of future generations to finance massive spending today. The Council of Economic Advisers examined their policy proposals and scored how much their economic agenda would cost the country.
EXECUTIVE SUMMARY
The CEA analyzed the fiscal and economic effects of eight policy pillars of the DSA agenda:
- Cancellation of all student debt and free college tuition
- Open borders and amnesty for illegal aliens
- Abolishing the police and prison system
- Medicare for All
- Universal rent control
- The Green New Deal
- A 32-hour workweek mandate
- A 5 percent annual wealth tax on billionaires
The net fiscal burden of the seven scoreable programs would total more than $49 trillion over ten years, amounting to approximately $355,000 per American household. This would be financed either by debt or by tax increases.
Table ES-1: Net Fiscal Burden of DSA Agenda Proposals (2027–2036)
(Ten-year totals in trillions of constant 2026 dollars. Positive = revenue, Negative = cost)
- Wealth Tax: +$3.94T
- Universal Rent Control: -$0.016T
- 32-Hour Workweek: -$0.918T
- Open Borders & Amnesty: -$0.53T
- Student Debt & Free Tuition: -$3.60T
- Green New Deal: -$0.37T
- Medicare for All: -$47.41T
- Net Total: -$48.90 Trillion
- Gross Total (excluding wealth-tax revenue): -$52.84 Trillion
(Note: The public-safety platform [Chapter 3] is not scored in fiscal terms due to its qualitative social impacts).
Macroeconomic Impacts
If financed by deficit spending (Debt):
- Interest rates on 10-year Treasury bonds would rise by 5.8 percentage points, likely breaching 10%, dramatically increasing borrowing costs for mortgages and small businesses.
- Inflation would increase to double-digit levels, with cumulative excess inflation of 130 to 160 percentage points over ten years.
If financed by tax hikes:
- U.S. economic output (real annual GDP) would permanently fall by 14.6% due to fewer machines, factories, and a 16.2% fall in total labor hours.
- After-tax hourly wages for the average household would shrink by 28.4%, an average loss of $22,000 in annual income (in 2026 dollars).
Public Safety Impacts
Empirical literature finds that abolishing police, eliminating cash bail, and shortening sentences raise crime. CEA estimates that 1,000 additional crimes per 100,000 people per year are associated with:
- A 110-day decrease in average life expectancy (2.5 years if violent).
- 173 more deaths per 100,000 people (if violent).
- 730 more children in poverty per 100,000 children.
- 1,430 to 1,640 fewer children who out-earn their parents.
- A $112.90 increase in average annual health insurance premiums.
CHAPTER 1: Student Debt Cancellation & Free College Tuition
Key Findings
- Student debt is concentrated among households with graduate degrees and above-median income.
- Because income-driven repayment (IDR) already forgives much of what low earners owe, cancellation is worth the least to low-income households.
- Canceling outstanding debt and funding a decade of free tuition would cost $2.1 trillion to $3.6 trillion, equaling 5% to 9% of existing federal debt.
The Reality of the Debt
Americans owe roughly $1.9 trillion in student debt. The DSA argues cancellation promotes equality, but data shows otherwise:
- By Income: The rate of student debt holding is lowest among the poorest households (15%) and peaks in the middle-to-upper income deciles (27-28%).
- By Education: Households with Master’s or Professional/Doctoral degrees hold the majority of student debt (60% combined), while those with no college degree hold only 7%.
- By Payment Share: The highest income quintile holds 34% of outstanding debt but makes 60% of monthly payments. The lowest quintile holds 8% of debt and makes 1% of payments.
The Cost of Forgiveness and Free Tuition
Because IDR plans already forgive balances for low earners, the present value of the debt is only about 76% of its face value. Forgiveness is worth close to the full balance for high earners and well under it for low earners.
- Cancellation Cost: ~$1.3 trillion (in present value).
- Free Tuition Cost: Assuming undergraduate tuition only, covering public institutions costs ~$84 billion/year. Extending to all institutions costs ~$233 billion/year. Over ten years, this totals $823 billion to $2.3 trillion.
- Total Package: $2.1 trillion to $3.6 trillion over ten years.
CHAPTER 2: Open Borders & Mass Amnesty
Key Findings
- Taxpayers currently bear a net lifetime fiscal cost of $166,716 per illegal alien, totaling $1.4T to $1.9T in aggregate.
- Granting amnesty would create new annual fiscal costs of $36 to $47 billion in SNAP, HUD housing vouchers, and Medicaid alone.
- DSA policies would reverse $227B to $287B in projected fiscal gains from recent immigration enforcement actions.
- A decrease in ICE arrest rates is empirically associated with rising monthly rent prices and increased property crime rates.
- Total 10-Year Cost: $440 billion to $613 billion.
Fiscal Costs of Amnesty
Illegal aliens are currently barred from most federal means-tested programs. Granting mass amnesty would make the existing population eligible for federal safety nets. CEA estimates this would create:
- $3.6 to $4.7 billion in new annual SNAP costs.
- $2.3 to $3.0 billion in new annual housing assistance costs.
- $30 to $40 billion in new annual federal Medicaid costs.
Quality-of-Life Benefits of Enforcement
Data analysis shows that higher ICE arrest rates are associated with statistically significant declines in median rent for new leases and property crime rates.
- A one log-point increase in the previous month’s ICE arrest rate corresponds with a 0.48% decline in median monthly rent for new leases.
- The same increase corresponds with a 1.8% decrease in the monthly property crime rate per 100,000 people.
DSA policies that grant amnesty or introduce open borders would reverse these gains, making America less affordable and less safe.
CHAPTER 3: Abolishing the Police and Prison System
Key Findings
The DSA platform demands defunding the police, ending the criminalization of working-class survival (reclassifying felonies), and securing freedom for all incarcerated people (eliminating cash bail and shortening sentences). CEA finds these policies would increase crime and reduce community safety.
Evidence That the Platform Increases Crime
- Defunding the Police: Empirical literature consistently shows that reductions in police staffing lead to higher crime. A 1% decrease in police presence is associated with a 0.34% increase in violent crimes and a 0.17% increase in property crimes. Hiring additional officers has a proven deterrent effect, saving lives and preventing robberies and auto thefts.
- Reclassifying Offenses: Studies of California’s Proposition 47 (which reclassified certain felonies as misdemeanors) show it depressed clearance rates and increased property crime, auto theft, and larceny. Offenders strategically respond to reduced penalties by stealing up to the new legal threshold.
- Abolishing Cash Bail & Shortening Sentences: New York’s initial bail reform (eliminating cash bail for most misdemeanors and nonviolent felonies) led to a statistically significant increase in re-arrest and recidivism, particularly among high-risk defendants. Similarly, reducing sentence lengths decreases incapacitation, leading to more crimes committed by offenders who would otherwise be incarcerated.
The Human Cost of Increased Crime
Using a fifty-state panel, CEA estimates the association between a 1,000-person increase in the crime rate (per 100,000 people) and severe social outcomes:
- Life Expectancy: Drops by 110 days (or 2.5 years if the crime is violent).
- Mortality: 173 additional deaths per 100,000 people (if violent).
- Child Poverty: 730 more children fall into poverty per 100,000.
- Economic Mobility: 1,430 to 1,640 fewer children out-earn their parents.
- Health Costs: Average annual health insurance premiums rise by $112.90 due to increased medical costs from crime-related injuries.
CHAPTER 4: Medicare for All (M4A)
Key Findings
- M4A would cost $49.4 trillion in single-payer health care costs over 2027–2036.
- Even after accounting for administrative savings ($2.8T) and federal Medicaid savings ($4.3T), the net federal budget deficit would increase by $47.4 trillion over ten years.
- Eliminating price-based incentives would reduce medical productivity by 22% by 2036, leading to massive wait times.
- The plan includes coverage for sex-change operations, estimated to cost taxpayers $6 billion (low) to $68 billion (high) over ten years.
Coverage and Access Impacts
M4A would eliminate employer-sponsored insurance, the individual market, and Medicaid, moving all 281 million non-elderly residents into a single “Other Public Insurance” category by 2028.
- Medical Productivity: Drops by 14% in the transition year and 22% by 2036 due to moral hazard and the elimination of cost-sharing incentives.
- Provider Access: While former Medicaid enrollees would see improved access, former employer-sponsored enrollees would see a 44% reduction in provider access, and former individual-market enrollees would see a 33% reduction, mirroring wait-time crises seen in Canada and the UK.
The Fiscal Reality
Even if all proposed financing options (employer payroll taxes, household income taxes, wealth taxes, etc.) are applied, they would raise only $17.189 trillion over the 2028–2036 period. This leaves a massive, unfunded cumulative federal shortfall of $27.7 trillion.
CHAPTER 5: Universal Rent Control
Key Findings
The DSA advocates for universal rent control. CEA modeled a central policy specification capping annual rent growth at 1.875%. Over ten years, this policy would:
- Reduce the number of rental housing units by 6.7% (3.3 million fewer units).
- Reduce the average quality of rental housing by 4.5%.
- Destroy $545.5 billion in economic value ($11,787 per controlled unit).
- Reduce real GDP by 0.33% to 0.54% after ten years.
The Mechanics of Destruction
Rent control prevents mutually beneficial exchanges. Property owners respond to capped revenues by:
- Reducing Supply: Converting rental units to condos or owner-occupied housing.
- Reducing Quality: Cutting maintenance and upkeep, disproportionately harming low-income tenants who cannot afford to move.
- Increasing Search Costs: Tenants spend more time and resources hunting for scarce units.
- Causing Misallocation: Incumbent tenants (often wealthier) stay in units that no longer fit their needs (e.g., empty nesters in large apartments), blocking younger, poorer workers from accessing housing near jobs.
Inefficient Wealth Transfer
While rent control transfers wealth from landlords to tenants, it is highly inefficient. CEA estimates that $0.83 to $1.06 of economic value is destroyed for every $1 transferred to tenants. The benefits disproportionately flow to wealthy, stable incumbent tenants, while the burdens (homelessness, poor quality, high search costs) fall heaviest on the poor and prospective tenants.
CHAPTER 6: The Green New Deal
Key Findings
The DSA’s Green New Deal focuses on total decarbonization and forced electrification. CEA estimates that reconfiguring over 80% of the nation’s grid and transportation energy sources would cost Americans and the economy more than $12 trillion over 25 years ($91,000 per household).
- Net Zero by 2050 Cost: $335 billion per year ($8.4 trillion aggregate).
- Building Electrification Mandates: $195–$288 billion per year in welfare losses.
- Transportation Electrification Mandates: $884 billion over ten years.
The Flaws of Forced Electrification
- Grid Instability: The U.S. grid still generates over 60% of its electricity from fossil fuels. Forcing a shift to intermittent renewables (wind/solar) without sufficient dispatchable generation creates severe reliability risks, as seen in recent international blackouts.
- Building Mandates: Banning gas heating and cooking reduces consumer choice. Studies show consumers have a high “willingness to pay” to avoid electrification mandates (up to $2,400/year in cold states). Forcing the switch raises average household electricity bills by at least 16.3% ($340/year) for heating alone, without actually reducing emissions at the margin if the grid remains gas-dependent.
- Transportation Mandates: EVs are significantly more expensive than gasoline counterparts (averaging $11,800 to $15,500 more). A mandate would cost Americans $643 billion in lost consumer surplus over ten years and prevent $244 billion in car sales entirely, as lower-income Americans are priced out of the market.
CHAPTER 7: The 32-Hour Workweek
Key Findings
The Thirty-Two Hour Workweek Act would require employers to lower work hours to 32 per week without cutting weekly pay, effectively mandating a 25% hourly wage increase, plus time-and-a-half overtime beyond 32 hours. CEA estimates this would:
- Reduce employment among affected workers by 8% to 12% (4.2 to 6.9 million jobs lost).
- Increase the unemployment rate to between 6.6% and 8.2%.
- Reduce annual GDP by 1.5%, a loss of $5.2 trillion over ten years.
- Reduce federal, state, and local tax revenue by $1.4 trillion over ten years.
The French Precedent
When France reduced its statutory workweek from 39 to 35 hours (with pay protected), studies found that absent massive government payroll subsidies, the mandate reduced employment by 4% and total hours by 9.5%. The burden fell heavily on lower-skill workers, while output declined.
Impact on the U.S. Economy
The U.S. proposal is twice as deep (a 20% reduction in hours vs. France’s 10%). Because the DSA proposal lacks the massive payroll subsidies France used to offset job losses, firms would be forced to absorb the 25% hourly cost increase. They would respond by:
- Laying off workers to maintain profitability.
- Reducing total hours worked.
- Passing costs to consumers via higher prices.
The measured increase in “productivity” under such a mandate is a statistical artifact caused by the displacement of lower-productivity workers from the labor market, not genuine efficiency gains.
CHAPTER 8: Wealth Tax
Key Findings
The DSA supports a 5% annual wealth tax on billionaires (e.g., the Make Billionaires Pay Their Fair Share Act). While sponsors claim it will raise $3.94 trillion over ten years, CEA finds it would severely damage the broader economy:
- Real Wages: Lowered by 2.5% (~$1,700/year loss for the median worker).
- Employment: Reduced by roughly 1.1 million workers by year ten.
- Real GDP: 2.43% lower than baseline by year ten ($8.6 trillion lost over a decade).
- Inflation: Price level 2.8% higher by year ten.
- Stock Market: Capitalization declines by $3.8 trillion, wiping out ~$2,100 from the median 401(k).
Why a Wealth Tax Hurts Everyone
A 5% tax on total wealth is not a small levy; it is equivalent to a 60% to 130% tax on the return of savings and capital, depending on the asset’s yield.
Billionaire wealth is not idle; it is predominantly tied up in corporate equities and unincorporated businesses (71% of their assets). Taxing this wealth at 5% annually is a direct tax on entrepreneurial activity. It lowers the after-tax return to entrepreneurship, causing business owners to invest less capital and hire fewer workers. This reduction in capital investment lowers labor productivity, which directly drives down wages and employment for everyday workers.
Revenue Illusions
The sponsors’ $4.4 trillion revenue estimate assumes a static 10% evasion rate and that evaded wealth magically remains productive and visible to the economy. Historical data from countries with wealth taxes (like Switzerland) show behavioral responses (evasion, avoidance, and capital flight) are massive. If a more realistic 43% behavioral response rate is applied, or if evaded wealth is removed from the productive tax base, the actual ten-year revenue would plummet to roughly $2.5 trillion, while the economic damage to GDP and wages would remain severe.
FINAL CONCLUSION
The Democratic Socialists of America’s agenda relies on taking resources from workers, entrepreneurs, and future generations to finance massive, immediate spending.
The CEA’s comprehensive scoring demonstrates that implementing these eight pillars would trigger a severe economic reversal. Whether financed by debt or taxes, the agenda would result in:
- Soaring inflation and interest rates.
- Millions of lost jobs and permanently lower wages.
- Reduced housing quality, healthcare access, and public safety.
- A significantly lower standard of living for the average American household.
The true cost of this agenda is not just measured in trillions of dollars, but in the diminished opportunities, security, and prosperity of the American people. (Read the original Document)
Sarvarthapedia Conceptual Network: Economic and Fiscal Policy
Sarvarthapedia knowledge web treats its eight policy areas not as isolated articles, but as interconnected nodes within larger systems of American Governance: Fiscal Policy, Public Finance, Labor, Capital, Housing, Healthcare, Immigration, Public Safety, Energy, Macroeconomics, and Intergenerational Distribution. The report itself organizes the material around eight policy pillars and evaluates their fiscal and economic effects over 2027–2036.
The network shows how a policy moves through the economic system: policy choice → institutional rule → incentives → human behaviour → market response → resource allocation → economic outcome → social outcome. Student debt connects with education, human capital, wages, and mobility; rent control with housing supply, property rights, and scarcity; healthcare reform with insurance, provider incentives, productivity, and access; taxation with investment, capital formation, wages, and government revenue.
At the higher level, these individual networks converge around State Capacity, Fiscal Capacity, Economic Productivity, Social Order, and Human Welfare. This creates a broader Sarvarthapedia knowledge web in which economics connects naturally with law, government, institutions, technology, markets, and civilization.
Core Node
Economic and Fiscal Policy
Core Concept:
The study of how governments collect revenue, incur expenditure, regulate economic activity, allocate public resources, and influence production, employment, prices, investment, and distribution.
Primary Connections
Economic and Fiscal Policy
→ Public Finance
→ Taxation
→ Government Spending
→ Public Debt
→ Macroeconomic Policy
→ Labor Economics
→ Capital Formation
→ Housing Economics
→ Healthcare Economics
→ Energy Economics
→ Immigration Economics
→ Public Safety Economics
→ Intergenerational Economics
See Also
Public Finance
↔ Fiscal Policy
↔ Taxation
↔ Government Expenditure
↔ Budget Deficit
↔ Public Debt
↔ Government Transfers
Cluster: Fiscal Burden
Public Expenditure
Government Spending
→ Program Cost
→ Fiscal Burden
→ Budget Deficit
→ Public Debt
→ Interest Payments
→ Taxation
The report calculates the combined fiscal effects of seven scoreable policy programs and presents a ten-year net fiscal burden of approximately $48.90 trillion, while separately reporting gross costs and estimated wealth-tax revenue.
Fiscal Financing
Policy Program
→ Revenue Requirement
→ Tax Financing OR Debt Financing
Debt Financing
→ Treasury Borrowing
→ Interest Rates
→ Private Borrowing Costs
→ Investment
Tax Financing
→ Disposable Income
→ Labor Incentives
→ Capital Formation
→ Output
See Also
Budget Deficit
↔ National Debt
↔ Treasury Bonds
↔ Interest Rates
↔ Tax Revenue
↔ Public Spending
↔ Crowding Out
Cluster: Macroeconomic Transmission
Inflation
Fiscal Expansion
→ Aggregate Demand
→ Price Level
→ Inflation
Inflation
→ Real Income
→ Real Wages
→ Household Purchasing Power
Interest Rates
Government Borrowing
→ Demand for Credit
→ Interest Rates
→ Mortgage Costs
→ Business Financing Costs
→ Investment
GDP
Labor Supply
- Capital Stock
- Productivity
→ Economic Output
Economic Policy
→ Labor Incentives
→ Capital Allocation
→ Productivity
→ GDP
The report connects alternative financing mechanisms to different macroeconomic channels, including interest rates, inflation, GDP, labor hours, wages, and household income.
See Also
GDP
↔ Productivity
↔ Labor Hours
↔ Capital Stock
↔ Inflation
↔ Interest Rates
↔ Real Wages
Cluster: Education and Human Capital
Student Debt
Higher Education
→ Tuition
→ Student Loans
→ Debt Service
→ Household Income
Debt Cancellation
Student Debt Cancellation
→ Debt Reduction
→ Household Balance Sheets
→ Federal Fiscal Cost
Free Tuition
Free College Tuition
→ Government Subsidy
→ Educational Access
→ Human Capital Formation
→ Future Labor Productivity
The report estimates the combined cost of debt cancellation and free tuition at approximately $2.1–$3.6 trillion over ten years, while emphasizing the distribution of existing student debt by income and education.
See Also
Education Economics
↔ Human Capital
↔ Student Debt
↔ Tuition Policy
↔ Income Distribution
↔ Labor Productivity
↔ Intergenerational Mobility
Cluster: Immigration and Fiscal State
Immigration
Immigration Policy
→ Labor Supply
→ Population
→ Tax Base
→ Public Services
→ Transfer Programs
Amnesty
Amnesty
→ Legal Status
→ Eligibility for Public Programs
→ Government Expenditure
The report specifically connects immigration status to eligibility for federal means-tested programs and estimates additional expenditures under its modeled amnesty scenario.
Housing Connection
Immigration
→ Population Demand
→ Housing Demand
→ Rents
Public Safety Connection
Immigration Enforcement
→ Enforcement Activity
→ Property Crime / Housing-Market Variables
The report presents statistical associations between ICE arrest rates, rent prices, and property crime; these should therefore be represented in Sarvarthapedia as reported empirical associations, rather than as universal causal propositions.
See Also
Immigration Economics
↔ Labor Supply
↔ Fiscal Incidence
↔ Welfare State
↔ Housing Demand
↔ Public Safety
↔ Population Economics
Cluster: Criminal Justice and Public Safety
Policing
Police Staffing
→ Law Enforcement Capacity
→ Deterrence
→ Crime Rate
Criminal Justice
Criminal Classification
→ Penalties
→ Deterrence
→ Offender Behavior
Bail Policy
→ Pretrial Detention
→ Release Conditions
→ Re-arrest / Recidivism
Sentence Length
→ Incapacitation
→ Criminal Opportunity
→ Crime
Social Cost of Crime
Crime
→ Mortality
→ Health Costs
→ Child Poverty
→ Economic Mobility
→ Life Expectancy
The report explicitly models crime as producing consequences extending beyond criminal justice, including mortality, poverty, mobility, and health-insurance costs.
See Also
Criminal Justice
↔ Policing
↔ Deterrence
↔ Bail
↔ Sentencing
↔ Recidivism
↔ Crime Economics
↔ Social Cost of Crime
Cluster: Healthcare State
Medicare for All
Universal Health Coverage
→ Single-Payer Financing
→ Government Expenditure
→ Taxation
→ Healthcare Access
Healthcare Market Structure
Employer Insurance
→ Private Insurance Market
Individual Insurance
→ Private Insurance Market
Medicaid
→ Public Insurance
Single-Payer System
→ Unified Public Financing
The report models a transition in which employer-sponsored insurance, the individual market, and Medicaid would be replaced by a single public insurance structure for the modeled population.
Healthcare Productivity
Payment Structure
→ Provider Incentives
→ Medical Productivity
→ Provider Capacity
→ Waiting Time
→ Access
See Also
Healthcare Economics
↔ Health Insurance
↔ Medicaid
↔ Employer-Sponsored Insurance
↔ Single-Payer Healthcare
↔ Medical Productivity
↔ Healthcare Access
↔ Healthcare Financing
Cluster: Housing Economics
Rent Control
Rent Control
→ Price Ceiling
→ Rental Revenue Constraint
→ Landlord Response
Landlord Response
→ Reduced Supply
→ Reduced Maintenance
→ Conversion of Rental Units
→ Search Costs
Housing Allocation
Controlled Rent
→ Lower Price for Incumbent Tenant
→ Excess Demand
→ Scarcity
→ Allocation Problem
The report models rent control as affecting rental supply, housing quality, search costs, and allocation of housing between incumbent and prospective tenants.
See Also
Housing Economics
↔ Rent Control
↔ Price Controls
↔ Housing Supply
↔ Housing Shortage
↔ Urban Economics
↔ Property Rights
↔ Rent-Seeking
Cluster: Energy and Climate Policy
Green New Deal
Climate Policy
→ Decarbonization
→ Energy Transition
→ Electrification
→ Infrastructure Investment
Electricity System
Electrification
→ Electricity Demand
→ Generation Capacity
→ Grid Infrastructure
→ Reliability
Transportation
Transportation Electrification
→ Electric Vehicles
→ Vehicle Market
→ Consumer Costs
→ Energy Demand
The report estimates costs associated with decarbonization, building electrification, and transportation electrification and discusses the relationship between energy mandates, electricity prices, infrastructure, and consumer choice.
See Also
Energy Economics
↔ Climate Economics
↔ Decarbonization
↔ Electricity Markets
↔ Power Grid
↔ Energy Security
↔ Electric Vehicles
↔ Infrastructure Economics
Cluster: Labor Economics
Working Hours
Workweek Regulation
→ Statutory Working Hours
→ Hourly Labor Cost
→ Employer Response
Employer Response
Higher Effective Labor Cost
→ Hiring Reduction
→ Hours Reduction
→ Automation / Capital Substitution
→ Price Adjustment
Employment
Labor Regulation
→ Employment
→ Unemployment
→ Labor Income
→ GDP
The report models a 32-hour workweek with protected weekly pay as an effective increase in hourly labor cost and connects that mechanism to employment, hours, GDP, and tax revenue.
See Also
Labor Economics
↔ Employment
↔ Unemployment
↔ Working Hours
↔ Minimum Wage
↔ Labor Productivity
↔ Automation
↔ Labor Demand
Cluster: Wealth, Capital and Taxation
Wealth Tax
Wealth Tax
→ Tax on Asset Holdings
→ After-Tax Return
→ Saving Incentive
→ Investment
→ Capital Formation
Capital Formation
Capital Stock
→ Labor Productivity
→ Wages
→ Employment
→ Economic Output
The report argues that a recurring wealth tax would interact with entrepreneurial wealth, corporate equity, investment incentives, wages, employment, and GDP. These are presented as the CEA’s modeled economic effects.
Tax Avoidance
Tax Rate
→ Behavioral Response
→ Tax Avoidance / Evasion
→ Tax Base
→ Actual Revenue
See Also
Taxation
↔ Wealth Tax
↔ Capital Gains
↔ Tax Avoidance
↔ Tax Evasion
↔ Entrepreneurship
↔ Investment
↔ Capital Formation
↔ Income Distribution
Cluster: Distribution and Incidence
Who Pays?
Government Policy
→ Taxpayer
→ Consumer
→ Worker
→ Investor
→ Landlord
→ Employer
→ Future Generation
Incidence
Statutory Taxpayer
≠ necessarily
Economic Bearer of Cost
Tax / Regulation
→ Behavioral Response
→ Price Adjustment
→ Wage Adjustment
→ Investment Adjustment
→ Final Incidence
Intergenerational Transfer
Current Spending
→ Debt
→ Future Tax Liability
→ Future Income
See Also
Tax Incidence
↔ Fiscal Incidence
↔ Income Distribution
↔ Wealth Distribution
↔ Generational Accounting
↔ Public Debt
↔ Intergenerational Equity
Cluster: Market Intervention
Common Mechanism
Government Intervention
→ Rule / Subsidy / Tax / Mandate / Price Control
→ Change in Incentives
→ Behavioral Response
→ Resource Allocation
→ Economic Outcome
Price Controls
Rent Control
→ Price Ceiling
→ Supply Response
→ Scarcity
Labor Mandates
32-Hour Workweek
→ Labor Cost
→ Employer Response
→ Employment
Energy Mandates
Electrification Mandate
→ Technology Choice
→ Capital Reallocation
→ Consumer Cost
Healthcare Regulation
Payment System
→ Provider Incentives
→ Medical Supply
→ Access
See Also
Government Regulation
↔ Market Failure
↔ Government Failure
↔ Price Controls
↔ Subsidies
↔ Mandates
↔ Regulatory Economics
↔ Public Choice
Cluster: Incentives
Incentive Architecture
Taxation
→ Return on Activity
→ Behavior
Subsidy
→ Reward for Activity
→ Behavior
Mandate
→ Required Behavior
→ Compliance Cost
Penalty
→ Expected Cost of Behavior
→ Deterrence
Cross-Cluster Network
Wealth Tax
→ Return on Capital
→ Investment
→ Capital Stock
→ Labor Productivity
→ Wages
Rent Control
→ Return on Rental Property
→ Housing Supply
→ Housing Quality
Workweek Mandate
→ Cost of Labor
→ Employment
→ Output
Carbon / Electrification Mandate
→ Energy Choice
→ Capital Allocation
→ Energy Cost
Healthcare Financing Reform
→ Provider Payment
→ Provider Behavior
→ Healthcare Supply
Cluster: Productivity
Production Function
Labor + Capital + Technology + Institutions
→ Productivity
→ Output
Policy Transmission
Taxation
→ Capital Return
→ Investment
→ Capital Stock
→ Productivity
Labor Regulation
→ Hours / Employment
→ Effective Labor Input
→ Output
Healthcare System
→ Health / Provider Capacity
→ Effective Labor Supply
Education
→ Human Capital
→ Labor Productivity
See Also
Productivity
↔ Capital Formation
↔ Human Capital
↔ Labor Supply
↔ Technology
↔ Innovation
↔ Economic Growth
Cluster: Household Welfare
Household Economic Position
Wages
- Employment
- Housing Costs
- Healthcare Costs
- Energy Costs
- Taxes
→ Disposable Income
Standard of Living
Disposable Income
- Access to Housing
- Healthcare Access
- Employment Security
- Public Safety
→ Household Welfare
The report’s final section frames its modeled outcomes through inflation, employment, wages, housing quality, healthcare access, public safety, and household living standards.
See Also
Household Economics
↔ Disposable Income
↔ Cost of Living
↔ Real Wages
↔ Employment Security
↔ Housing Affordability
↔ Healthcare Access
↔ Standard of Living
Master See-Also Knowledge Web
Central Economic Network
Economic Policy
↔ Fiscal Policy
↔ Monetary Conditions
↔ Taxation
↔ Government Spending
↔ Public Debt
↔ Inflation
↔ Interest Rates
↔ GDP
↔ Productivity
Human-Capital Network
Education
↔ Student Debt
↔ Human Capital
↔ Skills
↔ Labor Productivity
↔ Wages
↔ Economic Mobility
Labor Network
Labor Supply
↔ Working Hours
↔ Employment
↔ Unemployment
↔ Wages
↔ Productivity
↔ Capital Substitution
Capital Network
Wealth
↔ Savings
↔ Investment
↔ Capital Formation
↔ Entrepreneurship
↔ Productivity
↔ Wages
↔ Economic Growth
Housing Network
Housing Demand
↔ Housing Supply
↔ Rent
↔ Rent Control
↔ Property Rights
↔ Construction
↔ Urban Economics
↔ Household Wealth
Healthcare Network
Healthcare Financing
↔ Insurance
↔ Provider Incentives
↔ Medical Productivity
↔ Healthcare Supply
↔ Access
↔ Health Expenditure
Energy Network
Energy Policy
↔ Electricity
↔ Grid Infrastructure
↔ Transportation
↔ Electrification
↔ Decarbonization
↔ Energy Security
↔ Industrial Policy
State-Capacity Network
Government
↔ Tax Collection
↔ Public Expenditure
↔ Regulation
↔ Law Enforcement
↔ Public Services
↔ Administrative Capacity
↔ Fiscal Capacity
Social-Outcome Network
Economic Policy
→ Prices
→ Employment
→ Income
→ Housing
→ Healthcare
→ Public Safety
→ Mobility
→ Life Expectancy
→ Standard of Living
Sarvarthapedia Node Architecture
Node Type A: Foundational Concepts
Economics
Political Economy
Public Finance
Macroeconomics
Microeconomics
Fiscal Policy
Taxation
Government Spending
Markets
Property Rights
Incentives
Node Type B: Sectoral Concepts
Education Economics
Healthcare Economics
Housing Economics
Labor Economics
Energy Economics
Immigration Economics
Public Safety Economics
Node Type C: Mechanism Concepts
Price Ceiling
Tax Incidence
Fiscal Multiplier
Crowding Out
Capital Formation
Labor Supply
Labor Demand
Behavioral Response
Moral Hazard
Externality
Regulatory Cost
Node Type D: Outcome Concepts
GDP
Inflation
Employment
Unemployment
Real Wages
Productivity
Housing Supply
Healthcare Access
Public Safety
Economic Mobility
Standard of Living
Node Type E: Evidence and Measurement
Fiscal Score
Cost-Benefit Analysis
Distributional Analysis
Macroeconomic Modeling
Empirical Association
Causal Inference
Counterfactual Analysis
Behavioral Response
Sensitivity Analysis
The Deep Sarvarthapedia Relationship
Policy
Policy Choice
→ Institutional Rule
→ Incentive Structure
→ Human Behavior
→ Market Response
→ Resource Allocation
→ Production / Distribution
→ Fiscal Outcome
→ Social Outcome
Civilization-Level Connection
State Capacity
→ Fiscal Capacity
→ Infrastructure
→ Human Capital
→ Capital Formation
→ Productivity
→ Economic Surplus
→ Public Goods
→ Social Stability
→ Civilizational Capacity
Ultimate Knowledge Graph
Government
↔ Law
↔ Economics
↔ Institutions
↔ Markets
↔ Incentives
↔ Human Behavior
↔ Technology
↔ Capital
↔ Labor
↔ Resources
↔ Production
↔ Distribution
↔ Public Finance
↔ Social Order
↔ Human Welfare
↔ Civilization
This knowledge graph makes the document a network node rather than a standalone political-economy article: each of its eight policy subjects can become an independent Sarvarthapedia article, while the cross-links lead upward toward Political Economy → Public Finance → Institutional Economics → Economic Systems → State Capacity → Civilization as a Complex Adaptive System. The source-specific claims should remain attributed to the CEA report rather than being converted into Sarvarthapedia’s own conclusions.